Wednesday, January 26, 2011

USDCHF - 2011 Outlook


WEEKLY


The weekly chart has been on the decline from 1.17500 since May 2010. The trendline is being respected so far.


DAILY


The daily chart is also on a decline and presently unable to rise above the 50 point mark. In view of the current weakness of the dollar, the pressure seems to be on the downside. The daily RSI is currently on 38+. But historically USDCHF is cable of drastic movement up and down it can go as low as 16.67 point on the daily RSI and as high as 80.12. It is always helpful to understand the currency pairs you are trading.


Recommendation:


This is the time to wait until the daily RSI falls below 70. At least 2 daily candles will alert you when to buy or sell.


The weekly, daily and H4 charts are attached as usual.

Tuesday, January 25, 2011

EURUSD - 2011 Trade set-up


The EURUSD weekly chart is on an uptrend a continuation of the reversal of the fall from 1.51387. The current move started from 1.18757 and is currently moving into a wedge between the upper and lower trendline. A break of the trendline will determine the next direction

The daily chart is our trading guide. The daily chart has been on the uptrend move for the past fifteen days. The daily RSI is current around 65 point mark. It is getting ready short. Historically EURUSD is capable of going up to 78.750 mark. It is therefore necessary to watch the current move for the next few days until we see the first full bear candle. As you can see there is no bear candle now. Furthermore, a break of the uptrend line on H4 will confirm when this happens.

The weekly, daily and H4 charts are attached

GBPUSD - See where we are!


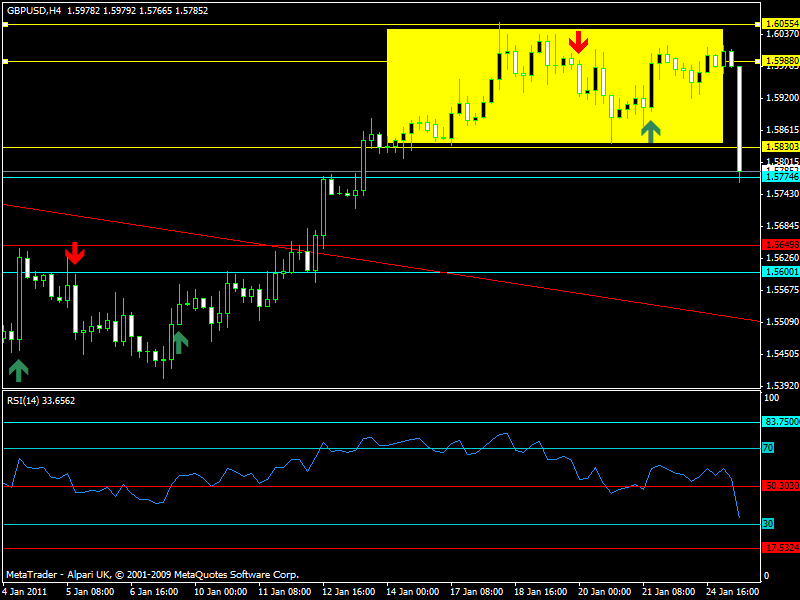
It's always a nice feeling when a set-up plays out nicely. The descent has begun, its is a matter of time before we reach 1.56000 while 1.53500 is beckoning

See where we are now on H4 and daily

Monday, January 24, 2011

GBPUSD - 220 Pips concrete zone


The Cable is currently forming the left shoulder of H&S on the weekly chart. A set-up which I identified when price was around 1.53500. As long as 1.61000 is not broken this set-up is still valid.


The daily is currently consolidating between 1.58821 and 1.60247, while the concrete zone is 1.60550 and 1.58300 (about 220 pips). Until a daily candle opens and closes outside the box, this zone is still valid.


How do you trade the current set-up? My view is the cable is primed for a fall. In this case follow H4 chart and short anywhere close to the top of the concrete zone, using M15 chart for entry.


Note that it is the big players that determine where they want to take the price. However, the concrete zone trading strategy will expose their intention. The first signal is that daily candle rise or fall within the concrete zone and lose outside it. The next signal is that a daily candle will open and close outside the zone. Then you will know the direction of the big boys.


I attach herewith the daily, h4 and m15 charts in support of the above analyses.


Enjoy your trading!

Friday, January 21, 2011

USDCAD - 2011


The weekly trend for USDCAD is downward and the daily chart is operating within the downtrend until price clearly breaks outside the trendline.


The recommended option is BUY using the daily RSI. SELL is huge risk until price clearly moves to the upper zone. The buy zone is indicated on the daily RSI with yellow color.


The recommendation is to wait until the RSI falls back into the yellow zone and buy the next bull candle. H4 will confirm reversal and M15 will entry.


The weekly and daily charts are attached.

Daily Forex Fundemental News

Search This Blog