The GBPJPY has been on an extended bullish run from around 118.00 since June 2012. Price has moved by over 3000 pips since then. The new government is determined to devalue the Yen further. The broke a solid resistance at 140 and currently appears to be heading towards 145, 150, 155 and possibly 160. On the other hand, the big players are capable of reversing the gains and forcing the government to start the devaluation process again
If you want additional information on how to take advantage the scenerios send an e-mail to diamondstrategiks@gmail.com for a copy of the 2013 GBPJPY Strategic Trading Plan.

Monday, January 14, 2013
Thursday, November 29, 2012
THE BEST TIME TO GO LONG (BUY) OR SHORT (SELL) FOR GBPUSD


What I will share today is the yearly trading cycle that is best suited for retail traders. Put differently, the safest months of the year to long or short. I have earlier discussed the period for a different purpose. If you want to know the best time to go long/short you will find the answer in the Monthly Price Action Analysis (MPAA). As a reminder, price moves for the first 6 months (Jan-June) in one direction (bull/bear), consolidates for the next 3 months (July-Sept), and closes for the last 3 months (Oct-Dec). For GBPUSD and most major pairs, prices reach their peaks (high/lows) twice in year i.e. May/June and Nov/Dec.
The best times for any retail trader to go long/short as long as the Cable is concern is therefore in the months May/June & Nov/Dec of every year. Nov/Dec are however not reliable because it is the end of the year. The big players after booking their profits, usually start on a clean slate and it could be bull/bear. November/December could go either way. On the other hand, May/June is the best period to take a decision on wheether to go long or short for the following reasons:
a) The ‘big players’ would have pushed the price in the desired direction for about 5 months
b) By this period, price would have moved by at least a thousand pips and more
c) After this period price generally don’t move far higher or lower, unless something dramatic happens
d) The highest/lowest prices for the year are usually recorded around this period
e) Most big players begin to book their profits and reverse their positions around this period of the year.
If you want to increase your chance of your success as a retail trader, roll your trading calendar from May to April of the following year, but always remember to book your profit between October-December.
I attached a monthly and a weekly charts for about 20 years period to clearly illustrate this above analysis.
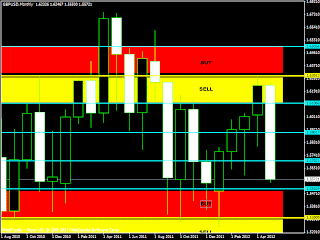
MONTHLY PRICE ACTION ANALYSIS (MPAA) - GBPUSD

Successes in forex trading could only be achieved if you have the bigger picture within your purview. To achieve this it is important to realise that you can only have a ‘helicopter view’ of the market in the higher time frames. The higher time frames provide useful insights into the trading parameters within a given period of time, which could be up to 2-4 years. With this knowledge it becomes easier to proceed to the lower time frames and trade confidently within the established boundary.
For a better understanding of the picture, we will now discuss, the Monthly Price Action Analysis (MPAA). As usual we will use the GBPUSD monthly to explain the MPAA for the period December 2008 – January 2012.
A closer observation of the monthly chart for GBPUSD will reveal the following facts:
a) If the cable begins a new year around the lowest point in a yearly circle, the point usually serve as a circle for a bullish run (rise in price)
b) If the cable begins a new year around the highest point in a yearly circle, the point usually serve as a circle for a bearish run (fall in price)
c) Price moves for the first 6 months (Jan-June), consolidates for the next 3 months (July-Sept), and closes for the last 3 months (Oct-Dec)
d) Price generally consolidate around the concrete zones
The question at this point is what is the usefulness of the above analysis in a simple language? The benefit of the MPAA is that the accounting year for the ‘big players’ (banks, hedge funds, investment outfits, etc) starts from January and ends in December. At the beginning of each year, depending on the fundamental factors, the big players push the price to a direction determined by fundamental factors (it doesn’t matter whether it is bull or bear). By the middle of the year, these players used the next three months see whether the bullish/bearish run will continue or not hence the consolidation around this period. These players use the last three months to take their profit and close their books for the year. The big players will never leave roll over their profit to another year. That is the monthly circle for the Cable.
What is then my view for 2012? I.5300 is proving to be a very strong support on all time frames and most importantly the weekly candle. I expect a consolidation around this area before the next major moves, when all the market movers return by the end of this month/1st week of February. Whichever directing they are going, the weekly candles will tell us. Due to the concern with Euro, the sentiment is down but 1.530 has not been broken since August 2008. If the weekly candle breaks out of this zone and the next candle opens and closes below this level, then we should begin to look at for a test of 1.430 which is the next support.
I attach a weekly chart showing consolidation around the master charts levels. This area of weekly consolidation is where I called the concrete zone. The weekly charts can consolidate for up to three months. The consolidation area for now is between 1.5360 and 1.5780 (about 420 pips) and the Masterchart support is 1.530 until firstly, the body of a weekly candle closed outside and secondly a the body of a weekly candle opens and closes outside this level. A pin outside 1.530 is a false breakout.
What I am trying to do here is to explain this process and give you knowledge to apply it to any situation. To gain confidence in your analysis pick the chart for any currency pair e.g. EURUSD, GBPJPY, AUDUSD, and try the MPAA through this simple process:
Ø Identify where the prices on the monthly chart are in Dec/Jan over a period of 2-3 years
Ø Identify the highest and lowest point for 2-3 years
Ø Identify weekly chart price reaction around the concrete zone
Ø Identify the consolidation areas (concrete zone)
You can post your charts here and I will endeavour, I will review them and tell you where you need to improve.
I attach the monthly for GBPUSD in support of MPAA and the weekly, daily, H4 and even H1 charts to show price reaction within our current 400 pips concrete zone.
50PPAA will tell you the immediate direction and read the mindset of a successful trader to know how to react to what you see in our charts.
I wish you successful trading in 2012.
Wednesday, November 28, 2012
THE MASTERCHART AND THE DRAGON (GBPJPY)
Those who have been following my previous posts on Mastercharts, would have read that the cyles for GBPJPY is between 1300-1500 pips. As volatile pair, the Dragon has little respect for the Masterchart support/resistance levels and would often violate these levels by as much as 300 pips. The best strategy for dealing with this volatility is to create a buffer zone of 300 pips around the Masterchart levels. For example 1000 pips price movement from 120-130 will have its buffer zones at 117-120 and 130-133 price ranges. You will only look for opportunities to either go long or short within the buffer zones. If you trade this way, you will avoid entring trades premature and getting severely burnt in the process. I attach herewith the followng 100 PPAA and 200 PPAA charts in support of this analysis


As I have mentioned before, the Masterchart for AUDUSD is 1500 pips divided into
two equal parts of 750 pips each i.e. 0.9500, 1.0250, 1.1000. If you look at the
monthly chart 1.0250 has been holding for the the past four months. The weekly
candle broke it once and jumped back again and is currently consolidating
between 1.0250 and 1.0420. The monthly charts says a re-test of 1.0650 is a
possibility, but the weekly candle needs to break out of either 1.0250 and
1.04200 for us to know the direction.




Subscribe to:
Posts (Atom)